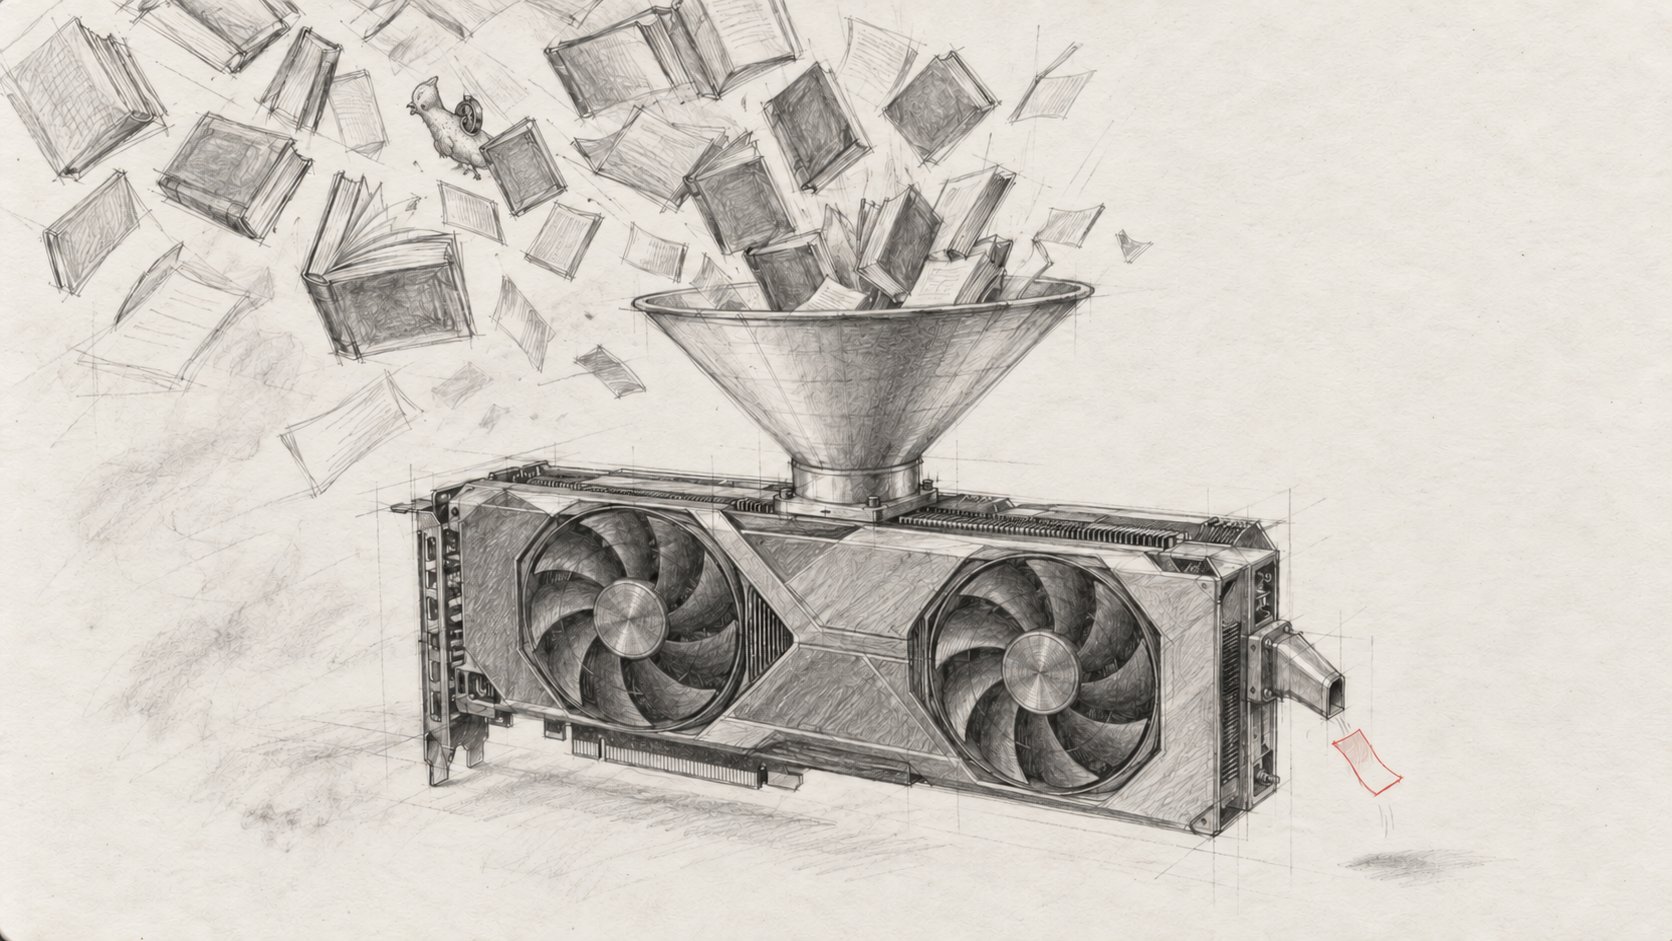
For about a year I used local models the easy way, asking codellama:13b in
Ollama a question now and then. Then I started using them for real work: coding
agents like Claude Code and Pi, and Hermes.
An agent sends big prompts with tool definitions and files in them, runs in a
loop, and carries the whole conversation in every request. The models worked,
but they were slow, and they got slower the longer a session went on.
By May this year I had an RTX 3090 at home, running llama.cpp or vLLM
depending on what I was testing. nvidia-smi showed it at 100% utilisation the
whole time it was generating. On any server that would mean the card was maxed
out and I needed a bigger one, and that’s how I read it.
That reading was wrong. When I timed the two parts of a request separately, the card turned out to spend most of each token waiting on memory, and a longer conversation made it worse. That changed how I pick quantization, context length and timeouts.
How this was written: I ran the tests and made the decisions described here, from my own notes and logs. AI tools helped me draft and edit the text and made the illustrations. I reviewed and edited the result.
What 100% means
NVIDIA’s documentation
defines utilization.gpu as the percentage of time over the sample period
“during which one or more kernels was executing on the GPU”. A reading of 100%
says something was running for the whole sample. It says nothing about how much
of the chip was in use.
iostat has the same problem with %util.
Its man page
warns that for devices serving requests in parallel,
the number “does not reflect their performance limits”, and an NVMe drive can
show 100% and still take a lot more work. Both numbers measure how much of the
time the device was busy.
Prefill and decode
A request has two parts, reading the prompt (prefill) and writing the answer (decode). I ran the dense Qwen3.6-27B on the 3090 with llama.cpp, at 200K context with a 4-bit KV cache, filled the context to different depths and timed both parts.
| Context filled | Prefill (tok/s) | Decode (tok/s) | Time to first token |
|---|---|---|---|
| 16K | 1,173 | 34.7 | 11.8 s |
| 32K | 1,063 | 31.7 | 14.9 s |
| 64K | 894 | 27.0 | 33.4 s |
| 96K | 729 | 23.6 | 40.6 s |
| 128K | 615 | 20.9 | 47.8 s |
| 160K | 531 | 18.7 | 56.4 s |
| 192K | 469 | 17.0 | 64.0 s |
Prefill handles all the prompt tokens together in large matrix multiplications and gets through over a thousand tokens a second. Decode writes one token at a time, and each token depends on the one before it, so inside one request there’s nothing to batch. For every token the GPU runs the whole model once, which means reading every weight from memory.
The speed limit
That puts a ceiling on decode you can calculate. The RTX 3090 reads its memory at up to 936 GB/s, according to NVIDIA’s GA102 whitepaper. The model file is 16.8 GB, but the embedding table (0.7 GB) is a lookup and a token only needs one row of it. Each token reads about 16.1 GB of weights, plus the KV cache, which on this model is about 0.3 GB at 16K of context.
936 GB/s ÷ (16.1 GB + 0.3 GB) ≈ 57 tokens per second
That’s an upper limit. 936 GB/s is the peak on the spec sheet and real code never gets all of it, and the sum assumes one request making one token at a time, which is how this test ran. I measured 34.7, about 60% of the limit.
The arithmetic is small next to that. Each token needs roughly 54 billion
floating-point operations, a multiply and an add for each weight, and the same
whitepaper puts the 3090 at over 35 trillion a second. That’s around 1.5 ms of a
token that took 29 ms. For the rest of the time the card was waiting on memory
while nvidia-smi showed 100%. The only ways to make one request faster are
fewer bytes per token or more bandwidth.
My everyday model at the time was a mixture-of-experts (MoE) model, which runs only a few of its experts for each token and so reads a fraction of its weights. At 32K it decoded at about 135 tokens a second against 31.7 for the dense model, 4.3 times faster on the same card.
All of this is for one request at a time. When several requests share one read of the weights, each extra one costs much less than the first, and serving engines like vLLM are built around that.
Why it gets slower as the conversation grows
Between 16K and 192K, decode speed halved with the same weights.
The model keeps a key and a value for every earlier token in its attention layers, so it doesn’t have to recompute the whole conversation for each new token. That’s the KV cache. Each request has its own, it grows by one entry per token, and every new token reads all of it.
On this model only 16 of the 64 layers keep a KV cache. That’s about 18 KB per token, or about 0.3 GB at 16K and 3.6 GB at 192K. At 192K a token reads about 19.7 GB instead of 16.4 GB, which brings the ceiling down from 57 to about 47 tokens a second.
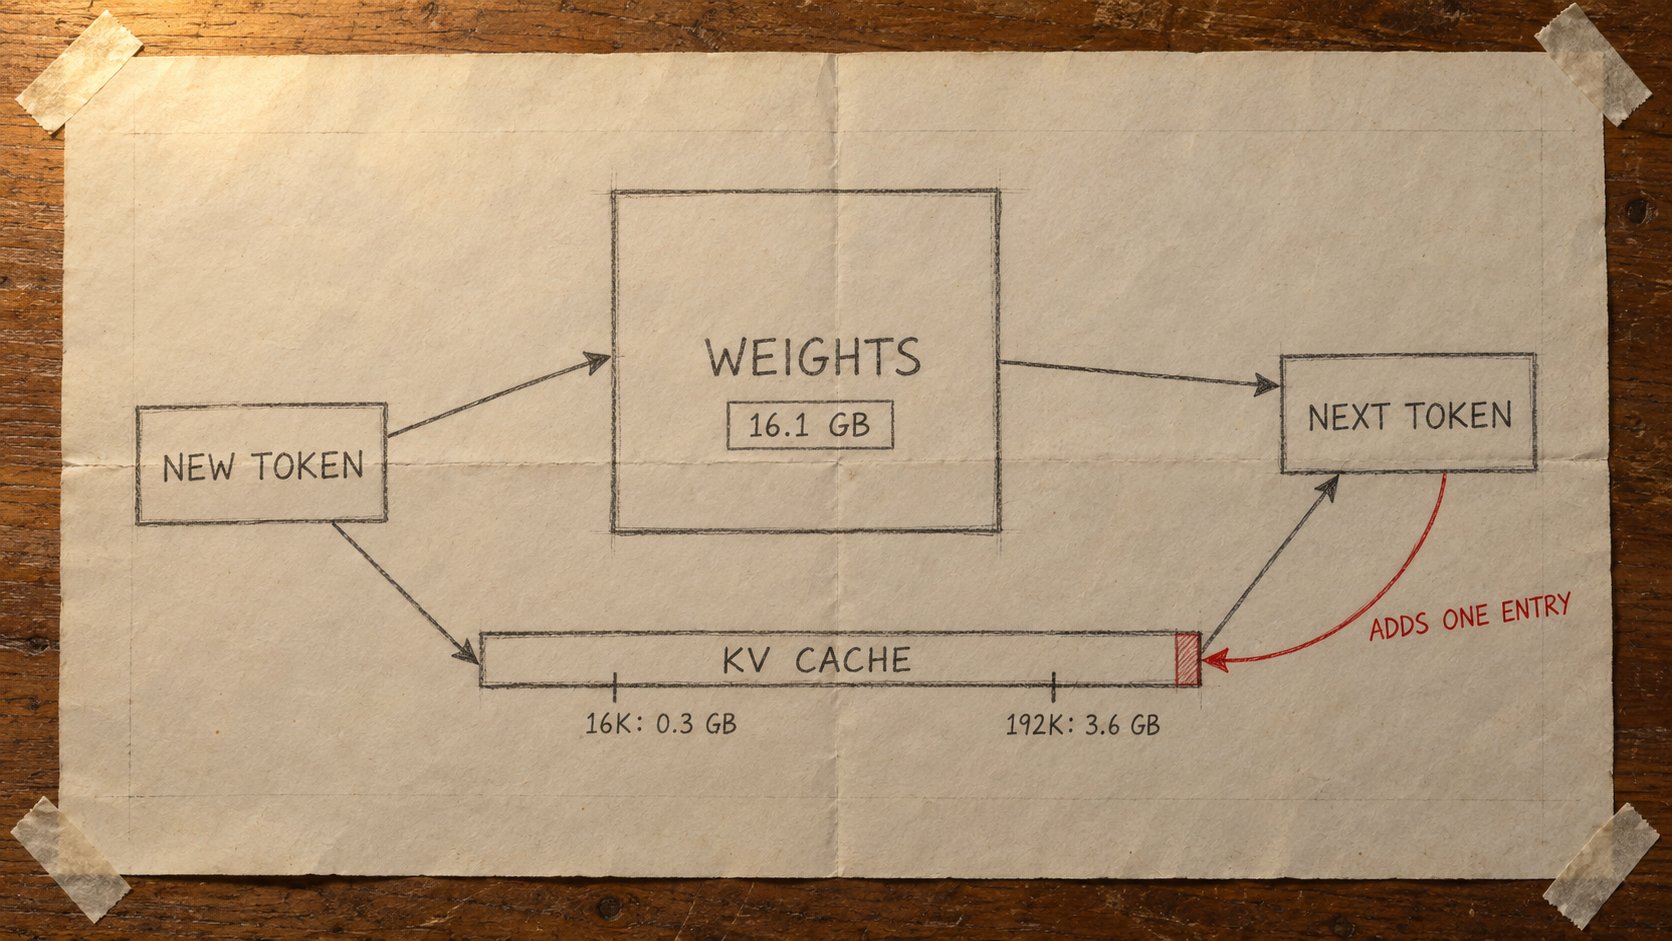
But decode fell to 17, much more than the extra bytes explain. I think the rest is the attention step, where every new token is compared with every earlier token in the cache, and that in llama.cpp with a 4-bit cache this step gets slow at 192K. I don’t have a profile to split it further.
Prefill slowed too. At 192K the model spent 64 seconds reading the prompt before it wrote anything, and because an agent re-sends its whole history every turn, that’s most of an agent’s wait.
What I changed
With one request, this card’s speed comes down to how many bytes each token
reads and how long the conversation has grown. The 100% in nvidia-smi shows
neither, so I stopped using it as a measure of load.
I now treat quantization as a speed setting as well as a way to make a model fit. I used to think of 4-bit only as smaller and a bit worse, but fewer bits per weight means fewer bytes per token, and that means faster decode.
Decode speed also sets timeouts. When I looked at moving from the MoE to the
dense model, the first thing that had to change was a timeout in Hermes. Its session_search.timeout was 90 seconds, set when the MoE
got through an 8,000-token reasoning budget in about 59 seconds. The dense model
needed around 130 seconds for half that budget.
I’d set the context to 200K because my coding agents default to it. It worked, but every token of history makes every token after it slower to write, and a shorter history makes an agent faster.
A second card
By the end of May I also needed more room. I wanted several agent sessions with big repositories running at the same time, and on one card I could give one session 200K of context in llama.cpp, or run three sessions at 48K each in vLLM.
A second 3090 was the obvious answer. I’d already rented a pair in the cloud in April to see what one would buy me, and the first result said two cards would make every token 21 times slower. Part 2 is about why I couldn’t trust that result.
Next in the series: Part 2, Two cards, too many variables