With vLLM running and nobody connected, nvidia-smi shows this:
GPU 0: 22,112 MiB / 24,576 MiB used, 0% utilisation
GPU 1: 22,134 MiB / 24,576 MiB used, 0% utilisation
My first thought was a memory leak, but vLLM takes that memory on purpose. My
config sets --gpu-memory-utilization 0.90, so when vLLM starts it claims 90%
of each GPU and manages that space itself. “Memory used” tells me nothing about
load.
What that memory holds sets how many requests the rig can serve at once. I got that limit wrong in September, and for a morning my coding agents looked hung on a server that was working fine. Working out the budget gave me the right limit, and the proxy in front of vLLM now enforces it.
How this was written: I ran the tests and made the decisions described here, from my own notes and logs. AI tools helped me draft and edit the text and made the illustrations. I reviewed and edited the result.
What the startup log says
vLLM writes its memory budget to the log when it starts. My rig serves a Qwen3.8 model with a 262,144-token context limit, and its log says:
Model loading took 8.98 GiB memory and 146.2 s
Available KV cache memory: 10.37 GiB
GPU KV cache size: 652,346 tokens
Maximum concurrency for 262,144 tokens per request: 2.49x
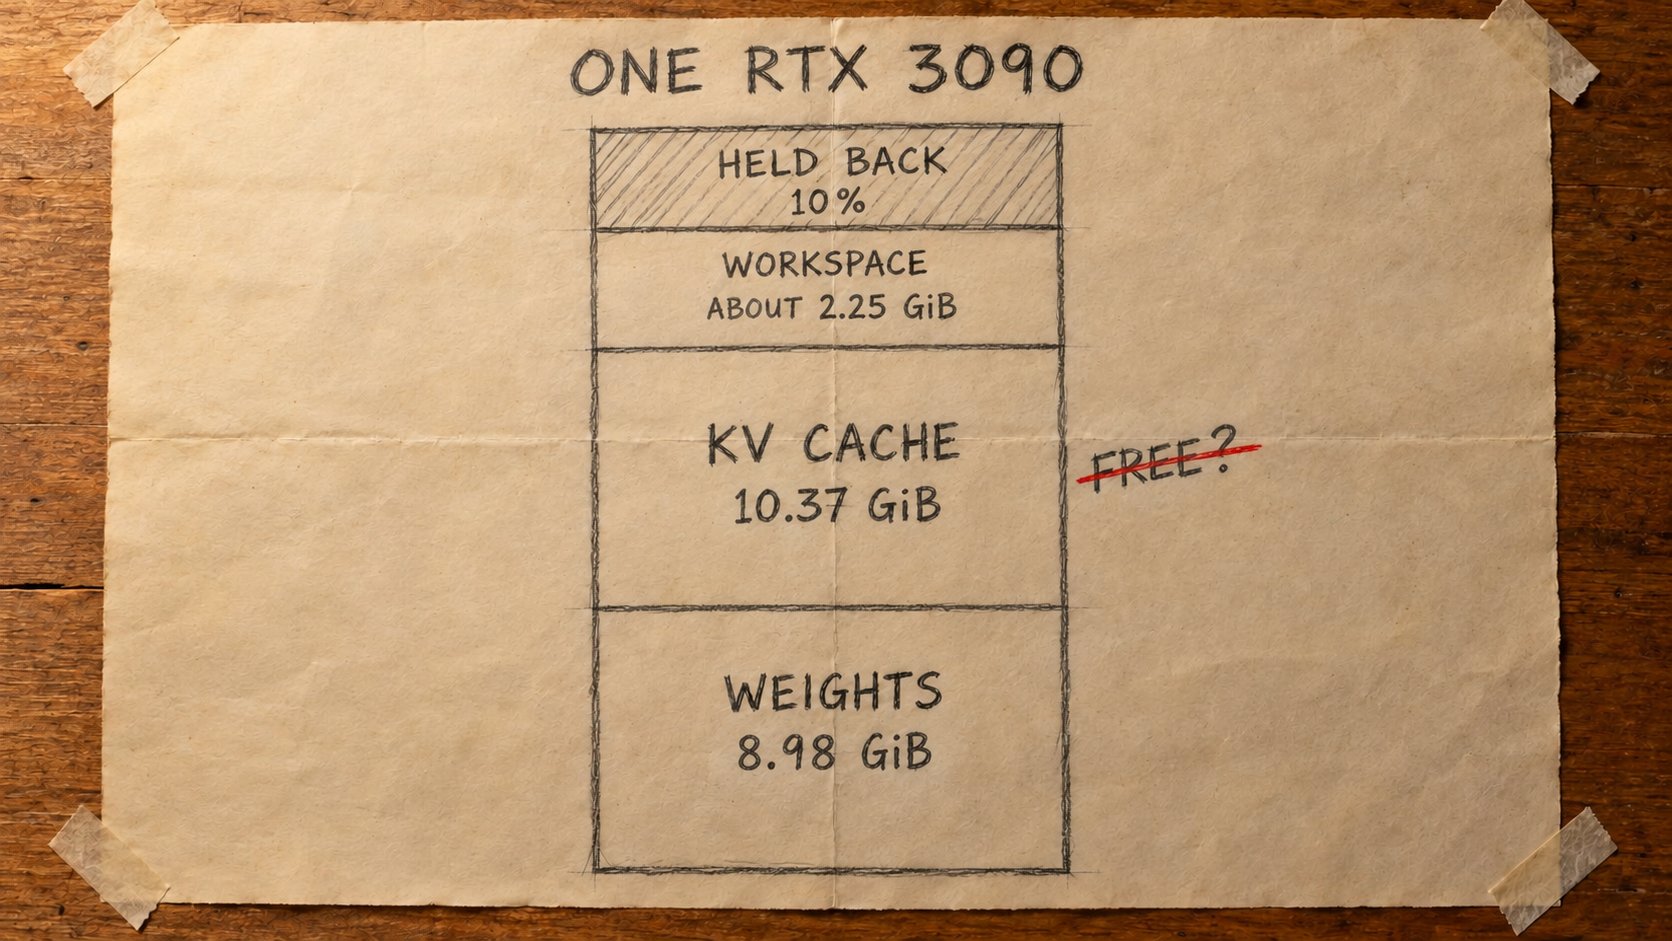
On each GPU, the 90% is split three ways, and the other 10% is held back:
- 8.98 GiB of weights, each card holding its half of the model.
- 10.37 GiB of KV cache, a pool of 652,346 tokens.
- About 2.25 GiB of workspace: activations, CUDA graphs and the like.
The KV cache pool is the upper bound on how much conversation state the GPUs can hold at once. Each token takes about 17 KiB of it on each GPU, because only 16 of this model’s 64 layers keep a KV cache, like the model in part 1. A request that fills the whole context needs 262,144 tokens of pool, and the pool holds 2.49 of those. That’s a ratio, 2.49 full-context equivalents, and it means I can promise two full-length requests. Shorter requests use less, and the scheduler’s limit, shared prompts and the arrival pattern all change how many actually run.
Paged, like virtual memory
The obvious way to store the KV cache is one contiguous buffer per request, sized for the longest conversation it might have. Most conversations never get that long. When the PagedAttention paper profiled serving systems that worked this way, only 20.4% to 38.2% of their KV cache memory was storing actual tokens.
vLLM splits the cache into small fixed-size blocks instead, hands them out as a conversation grows, and keeps a block table for each request. The paper says the idea comes from virtual memory in operating systems, with blocks as pages and the block table as a page table. A short request holds only the blocks it has filled, and requests that start with the same system prompt can share theirs.
When the pool runs out, vLLM doesn’t swap to disk. It preempts a request and recomputes its cache later. The nearest thing to swap, vLLM’s CPU KV offload, which I tried in July, never brought any of my 108K-token test histories back, and replaying an old conversation still cost about 50 seconds of prefill. I turned it off.
Context length
For a given startup configuration the pool is fixed, and what fits in it depends on the context limit, the cache format and any buffers other features reserve. The context limit matters most. In August, on an earlier Qwen3.8 checkpoint with a slightly smaller pool than the one above, I stepped the limit up from 131K to 262K, changing only the context limit and the scheduler’s sequence cap. vLLM reported:
| Context limit | KV pool | Full-context equivalents |
|---|---|---|
| 131,072 | 586,911 tokens | 4.48 |
| 147,456 | 600,043 tokens | 4.07 |
| 163,840 | 606,650 tokens | 3.70 |
| 196,608 | 616,634 tokens | 3.14 |
| 262,144 | 623,721 tokens | 2.38 |
The pool moved a little with each restart, but doubling the context limit nearly halved the full-context equivalents, from 4.48 to 2.38.
I got the same trade-off wrong once in a temporary llama.cpp setup. In the build
I was running,
--ctx-size
is the total across all slots, and --ctx-size 98304 --parallel 3 gave each
client 32,768 tokens, not 98,304.
Cache format
Fewer bytes per token fits more tokens. My vLLM config uses
--kv-cache-dtype fp8_e4m3.
On llama.cpp with my dense 27B, four cache configurations were all within 3% of each other on speed, and I used the smallest. That test measured speed only. For quality I ran a single-needle test: with a 4-bit cache, the model found one planted sentence halfway through a 212K-token prompt. That’s the easiest retrieval test there is, and it doesn’t show the smaller cache keeps quality on real agent work. Results also vary by model. The Frontier Lab tested nine models and found quantizing the cache sped up six of them and slowed down the two with the newest attention designs.
I also tried vLLM’s TurboQuant cache type, turboquant_k8v4, which by its name
keeps keys at 8 bits and values at 4. At the 262K step of the August test it
grew the pool from 623,721 to 817,968 tokens, 31.1% more. But with four long
sessions at once each stream got between 0.5 and 1.4 tokens a second, and a
six-session run never finished cleanly. I rejected it.
Reserved buffers
Some features reserve memory at startup, before any request arrives. I trained a small LoRA adapter (rank 8) for Gemma 4 31B, a model I was testing on the same two 3090s. Without LoRA, its weights took 10.67 GiB per GPU and its pool held 91,387 tokens.
The serving setup I was targeting starts vLLM with max_loras=8 and
max_lora_rank=128, and vLLM reserved buffers for all eight slots. Model memory
went to 20.39 GiB per GPU, the KV cache came out at −0.48 GiB, and vLLM refused
to start. With max_loras=1 and max_lora_rank=8, sized to the one adapter I
had, it started with a pool of 89,979 tokens, 1,408 fewer than without LoRA.
The day the agents looked stuck
In early September I had switched to Qwopus3.8-27B, because I wanted a model that can read images. One morning that month my coding agents looked hung. The rig was serving Qwopus at a 131,072-token context, and its pool held about 2.46 full-context equivalents. The small proxy in front of vLLM was letting in up to six generation requests at a time, and at one point vLLM had four running and two waiting. Both 3090s were at 100% utilisation and KV cache usage kept hitting 90 to 100%, with no OOMs, no Xid errors and no restarts. The running requests were making progress, but the waiting ones looked dead to the agents.
vLLM was working as designed. When the pool is full, new requests wait, and I was admitting six requests to a pool that held fewer than two and a half full-length ones.
I had already tried a smarter admission controller in July, which classified requests and prioritised them. It made interactive work worse than talking to vLLM directly, and I retired it.
So I lowered the proxy’s cap from six to four. Four full-length requests wouldn’t
fit either. The cap is a policy for my mix of agent requests, most of them much
shorter than 131K, and it keeps the queue short. The proxy refuses any
generation request over the cap immediately with HTTP 503 and Retry-After: 1,
and it never caps health, metrics or model-list calls. After the change, four
simultaneous requests completed in about 17.9 seconds each, and the fifth got
its 503 in 0.01 seconds.
It’s the same idea as MaxRequestWorkers on Apache or a connection limit on a
database. A request that is refused straight away can retry or go elsewhere,
while a request the cache can’t hold just waits.
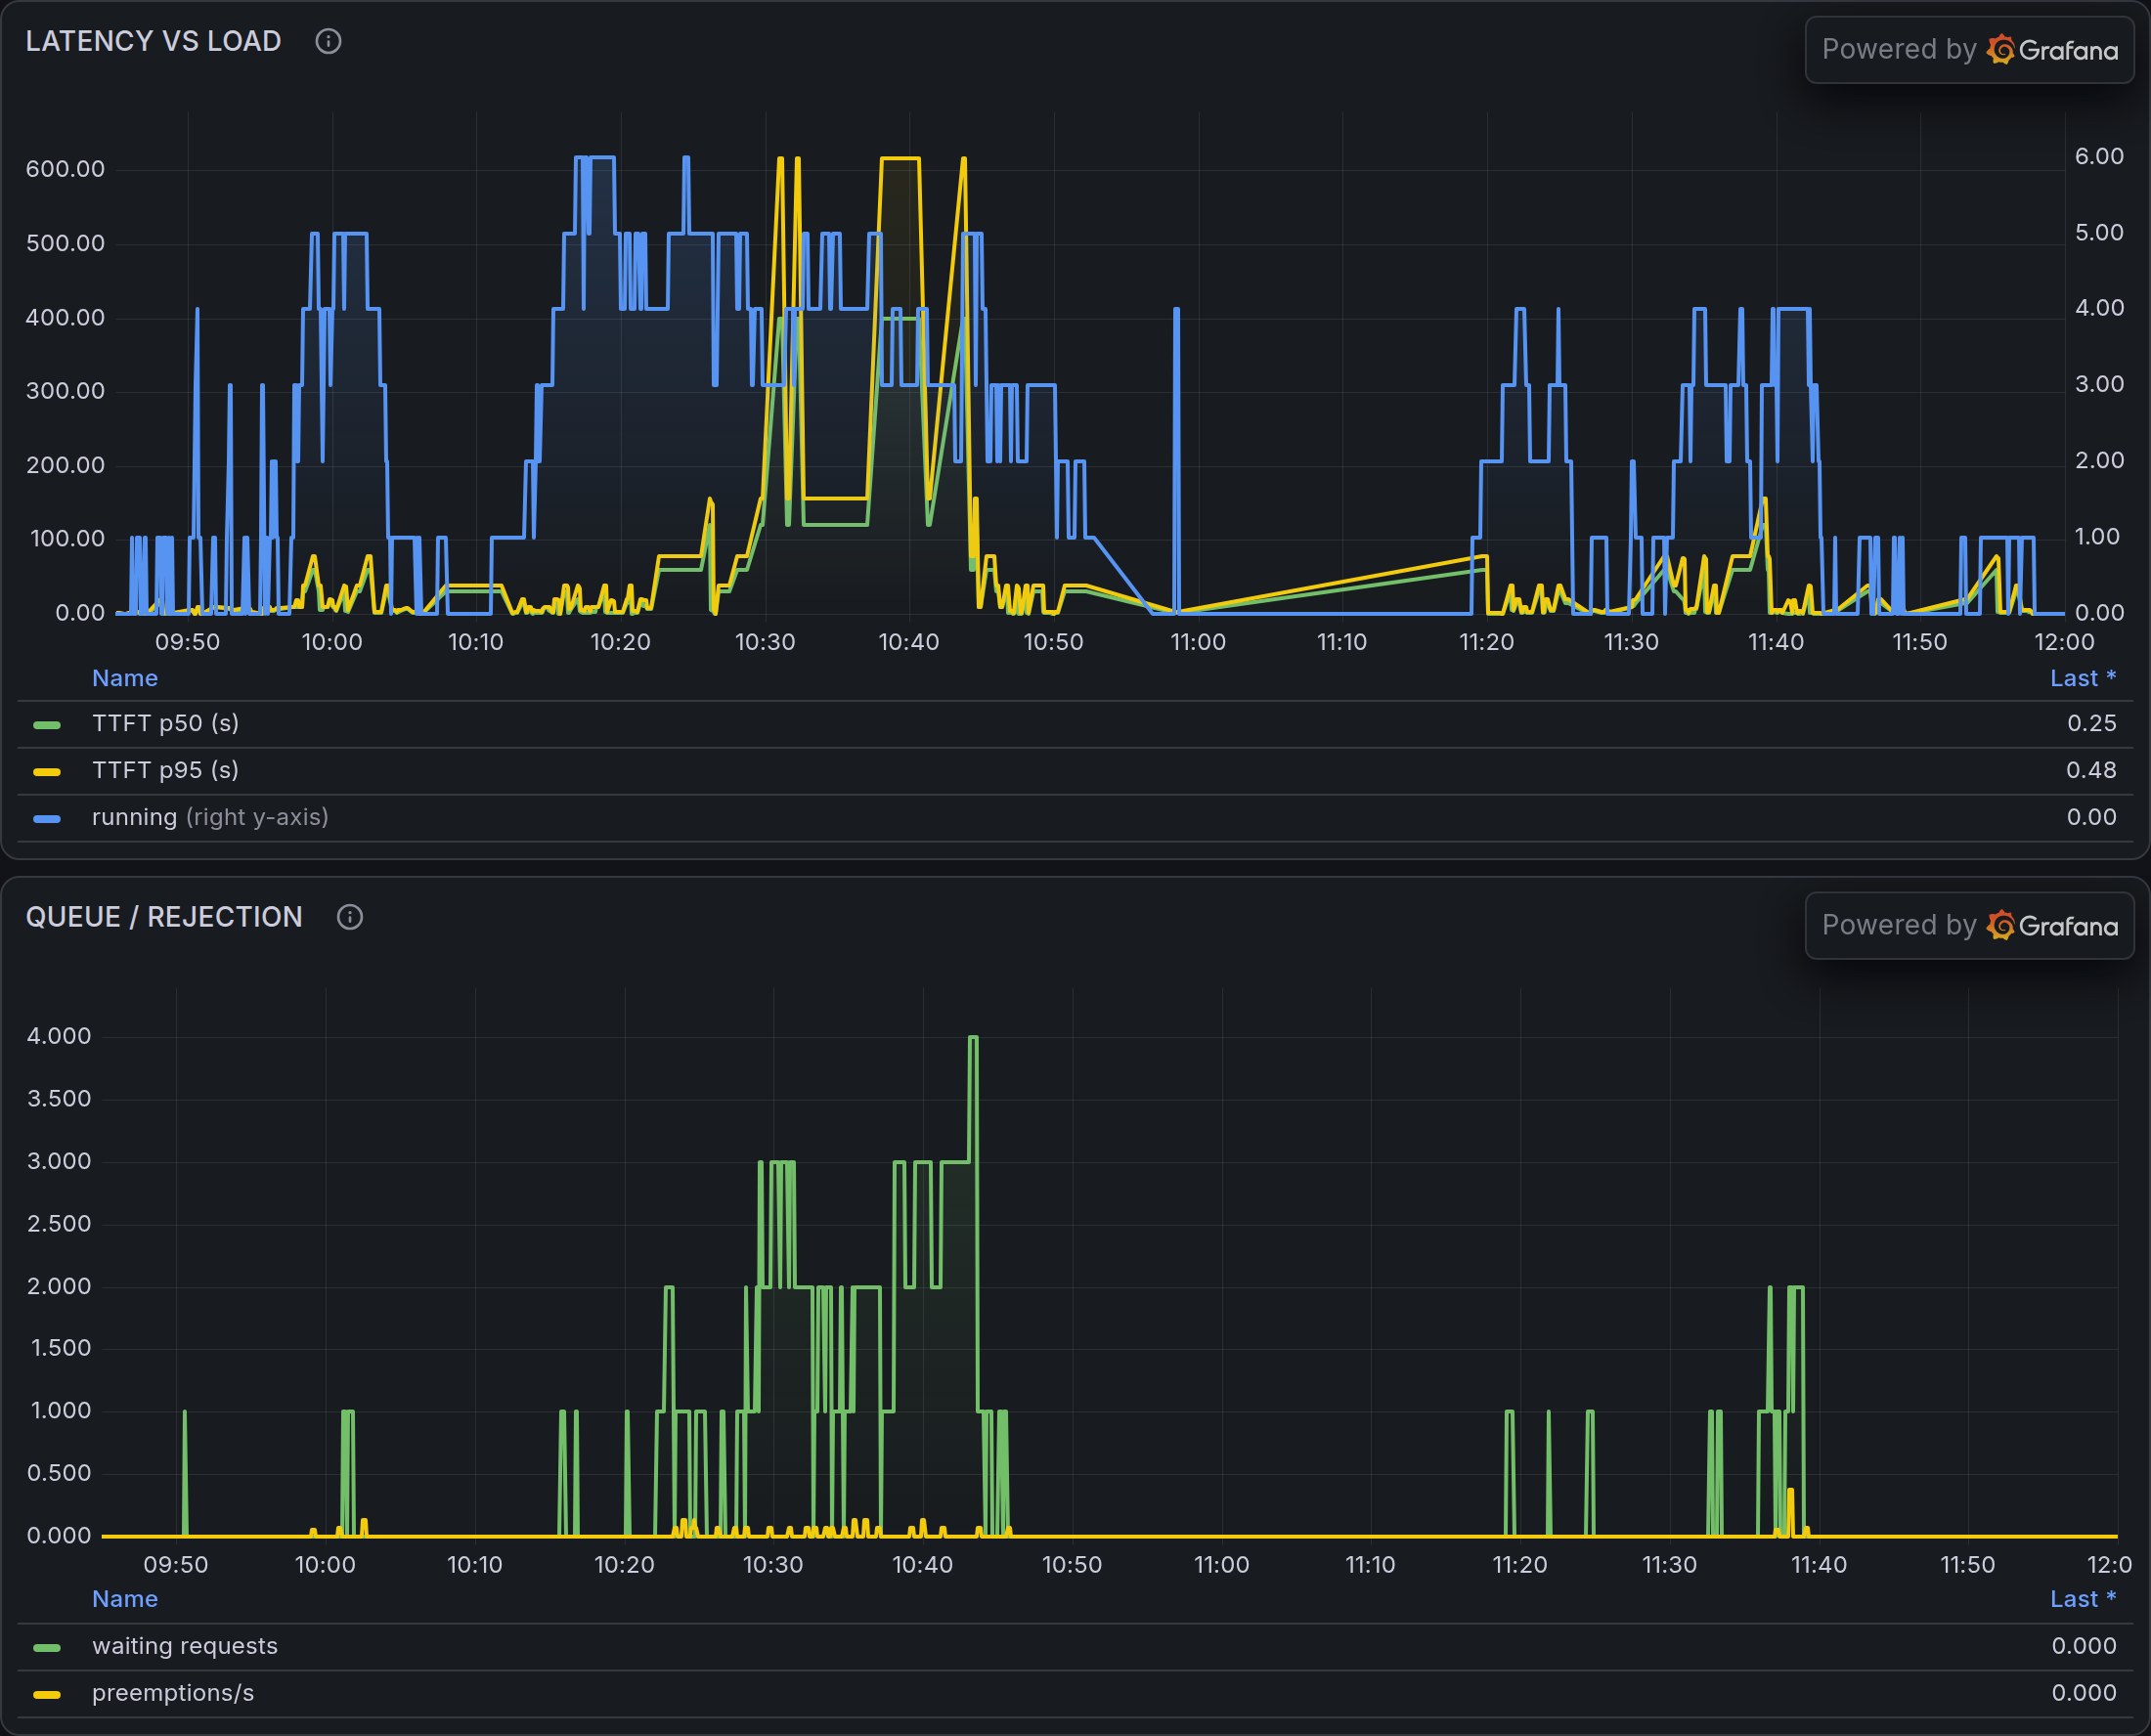
Until 10:50, up to six requests were running, up to four were waiting, and p95 time to first token reached about 600 seconds. After the cap went to four, running stayed at four or less, the queue was empty most of the time, and the worst p95 was about 150 seconds.
Later in September I moved to a 262,144-token context and lowered the cap to two. The setup in the startup log at the top of this post holds 2.49 full-context equivalents, so the cap is still two. A third generation request gets a 503 and retries instead of waiting behind a full pool, and both GPUs still show about 22 GiB used when nothing is running.